Water Sampling History – 2000 to 2019
Watershed Sampling History – 2000 to 2019
The Eagle Lake Association works with local areas of Government and Agencies to keep Eagle Lake at the forefront of potential funding opportunities that will preserve and enhance our lakes water quality.
The monitoring we do on the lake and watershed are listed in the EQuIS data base. This data is used by state environmental agencies, EPA and other federal agencies, universities, private citizens, and many others. This mean that our hard work and continuous monitoring efforts over the years will be usable data for the above listed agencies to use in helping them develop long term strategies for improving water quality in our state and county.
Please remember to do your part in protecting our lakes and streams. Do not use Phosphorus in your fertilizer. This gets into the lake and helps produce weeds and algae. One pound of Phosphorus produces 300-500 lbs of weeds. Do not rake or burn your leaves in or near the shoreline. Leaves are also very phosphorus rich. Dumping your leaves across the road in ditches and wetland areas are storage basins to help slow down the transfer of pollution from run off. This water eventually ends up in the lake. Illegal dumping is also against the law!
Water Sampling
Each year the Eagle Lake Improvement Association budgets $900 (about 12% of the budget) for sampling water from both the lake and the watershed that flows into the lake. Our historical records show samples as far back as the early 1970’s but through 1999 only 9 sample results for water quality exist in our records. Starting in 2000 Eagle Lake Improvement Association began a more rigorous schedule of sampling the lake and the small streams that drain the watershed into Eagle lake. The purpose of monitoring the water is to catalog existing water quality parameters so that we can detect changes due to watershed management changes. The water quality parameters we are sampling are; phosphorous level, algae level, clarity, temperature and recreational and aesthetic suitability. Our goal is to understand our lake and water so that we maintain or improve recreational and aesthetic quality of the lake.
Water samples are collected each month from May through September. We collect from 5 small streams that drain the watershed into Eagle Lake and we sample the lake itself. The watershed sampling was designed with the aid of the Minnesota Department of Natural Resources (DNR). At each of the five watershed stops we collect; two water samples, temperature, and notes on water level, recreational suitability and aesthetic appearance.
Phosphorous
The two water samples are for total phosphorous amount and for ortho-phosphorous amount. Phosphorous is a chemical element essential for all living things and is found in rocks, soil, plants, fish and other animals, basically everywhere. Phosphorous is an essential nutrient in the lake but high phosphorous levels lead to excess algae growth which is undesirable. The total phosphorous sample is able to detect all chemical forms of phosphorous. The ortho-phosphorous sample only detects the chemical form that is immediately available for uptake by plants. The difference between the two can be an indication of the sediment load that the water carries. Sampling phosphorous in the watershed allows us to see how much phosphorous is coming into the lake. There will always be some coming into the lake so we also record whether or not the sample was within 24-hours of a rain event. The question then becomes does rainfall runoff from the watershed increase the phosphorous load in the water. The data so far shows a slight increase in phosphorous after a rain event. Data since 2000, also shows that the phosphorous load flowing into Eagle lake is decreasing. Additionally Eagle lake phosphorous content has been declining, primarily due to a decrease in the phosphorous in our spring samples. Spring runoff is the most critical because this is when we tend to get heavier rains and agricultural land has not yet established sufficient plant cover to slow erosion into streams. This is good news and shows that some of the adjustments in the watershed have been beneficial to slowing the addition of phosphorous to the lake. One of the significant adjustments in the watershed was to put berms in the fields to the southeast of the lake, this has slowed the water flow to the lake. Slowing down the water flow is important for reducing sediment and phosphorous flow into the lake.
Water Clarity
Water clarity is another concern of the water quality sampling. Lake clarity is sampled with a Secchi disk lowered on a measured rope. Stream clarity is measured with a small Secchi disk in a 1 meter tube filled with the stream water. Lake clarity is generally greatest in the spring and least in the summer the spring clarity depth has averaged 7.5 ft since 2000, while summer clarity averages 5.5 ft. Clarity is affected both by sediment in the water as well as algae amount. The stream clarity is primarily affected by sediment and the lake clarity by both fine particle sediment and algae presence. The data indicates the stream clarity decreases slightly after a rain event due to the presence of more sediment from erosion. Lake clarity is much more complex because algae growth is much less predictable. Lake clarity is measured frequently, and algae samples are taken once a month. Algae level is assessed by the amount of chlorophyll A in the water sample. Chlorophyll A is a pigment that reflects green light and is largely responsible for the green appearance of algae and plants. Although blue-green algae is actually a bacteria, it also photosynthesizes and thus also contributes to the chlorophyll A amount in a sample. Blue-green algae outbreaks are recorded but these occurrences still remain infrequent and unpredictable and can even occur underneath the ice in the winter.
Other notes that are compiled when samples are taken are apparent suitability for recreation, the aesthetic appearance, and the temperature of the water. No major trends have been noted in these.
All this information is used to monitor the lake health overtime and to understand the impact of changes in the watershed that flows into the lake. The data gives us a way to argue for possible changes via policy with the DNR or to notice anything positive or negative that might need to be addressed. The board believes it to be a critical task to continue to monitor the lake and watershed to help us understand our lake and preserve its quality.
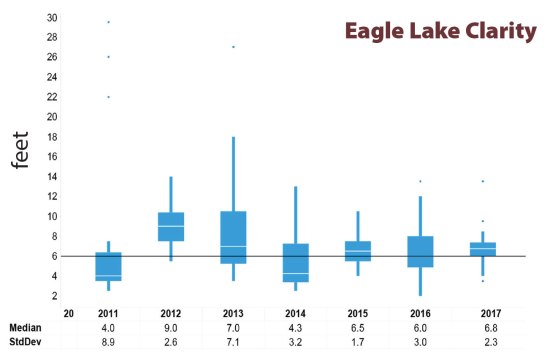
Eagle Lake clarity measured in feet shows that 2017 was an above average year for clarity. We average about 6 feet of clarity since 2000. 2017 median clarity was 6.8 feet. The horizontal line in the graph shows the median value of clarity across the years. The size of the box in the graph indicates the range in variability of the sample measurements.

Algae content in Eagle Lake is estimated using the amount of the molecule chlorophyll A in solution. As shown by the box on the right side of the graph, 2017 algae concentration was consistently low. We also had very few algae blooms this year. The horizontal line is the median measured chlorophyll A since 2000. Four of the last 6 years have seen lower than average algae growth in the lake.

The concentration of phosphorous in the lake for 2017, like the algae content, was below average, and was consistently so from month to month. And also good news is that phosphorous concentrations have been below average, as represented by the horizontal line, for five of the last six years. Algae growth is favored with higher concentrations of phosphorous.

In addition to water samples for the lake, we also assess the water flowing into the lake. The watershed measurements have been fairly consistent across time. On the positive side, the watershed samples have shown that since 2006, we rarely observe excessive concentrations of phosphorous in the streams flowing into Eagle (data not shown). On the negative side, two of the sites have an increased sediment load over time, most notably is the sediment carried into the lake from the Halvorson slough, the graph shows the decrease in clarity of the water coming in through that slew. We can use this data to encourage government agencies or private interests to help implement a better water management system.
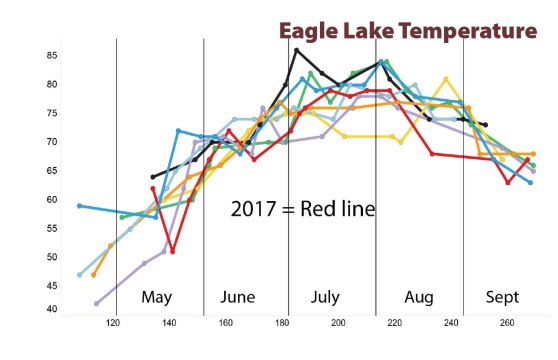
The surface temperature of the lake is measured regularly in the central area of the lake from April to September. Each line in the graph represents temperature measurements from an individual year from 2010 through 2017. A large body of water like Eagle tends to have fairly stable temperature from year to year relative to what we experience on land.
